Lots of malware inject code into legitimate processes for various reasons like stealthy execution, API hooking, man in browser attack. Identifying injected code on an LIVE system can be a tedious task. Going through the process of memory forensics can be time consuming and may not be always helpful.
Here is our command line tool “Intelliroot Injected code Hunter” to help you identify injected code. The tool can identify and extract possibly injected code from the processes on a LIVE windows system. The tool can be used for Threat Hunting, Malware Analysis and Incident Response.
The tool is pretty easy to use. You can download the tool from the following github https://github.com/intelliroot-tech/InjectedCodeHunter The tool has both x86 and x64 versions. You can run the tool from the command prompt running in administrator mode. The tool iterates through various processes by applying certain heuristics and is able to identify the injected code. Our tool not only identifies the injected code but also creates a dump of the injected code to a file just like the Volatility Malfind plugin. The only difference is it does not need a memory dump to do so and can execute on a live machine.
The screenshot displays the output of the tool.
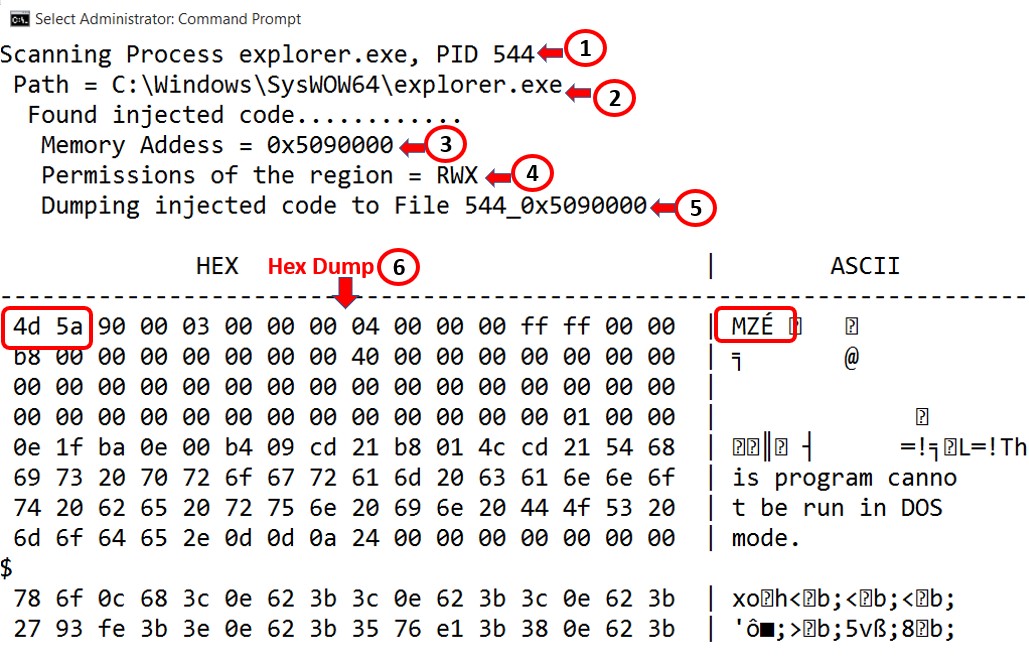
Description of Items in the screenshot.
1 - Process name and PID of the target process in which injected code was discovered
2 - Complete path of the executable of the process
3 - Address of the injected code(0x5090000) in virtual memory of the process
4 - Permission of the memory region of the injected code
5 - File into which injected code is dumped (544_0x5090000)
6 - Hex dump of the injected code
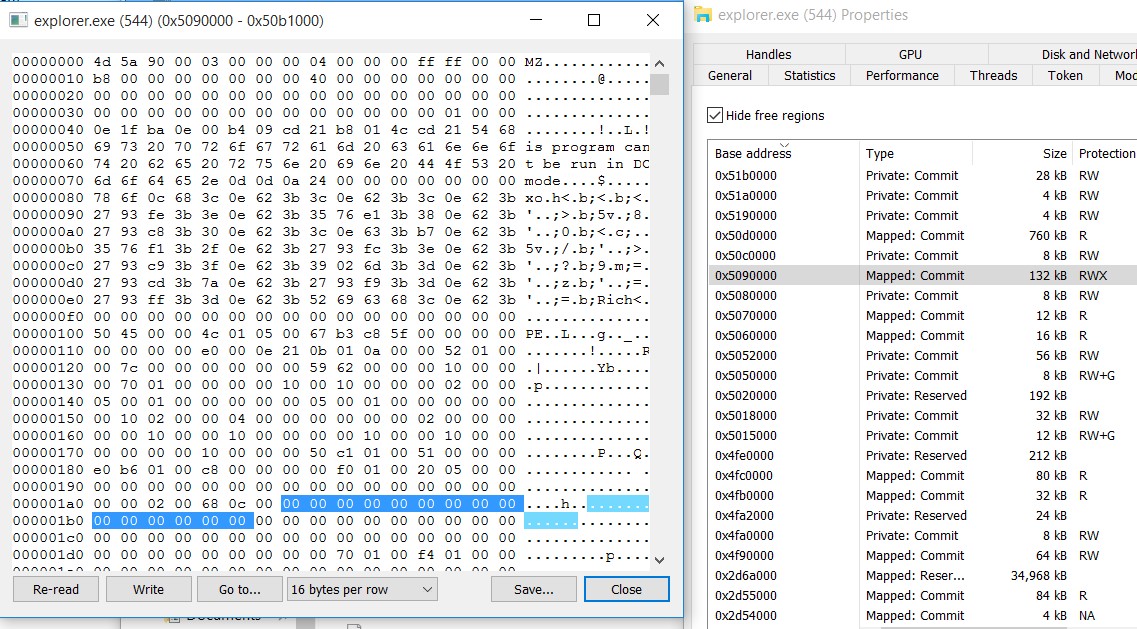
If you observe the injected code hex dump, it begins with a MZ header which is a clear indication of code injection. If you want to verify the injected code using another tool, Process Hacker (https://processhacker.sourceforge.io/) can help you. You can use the PID and Address of injected to navigate to the injected code in process hacker. The below screenshot shows the injected code in process hacker.
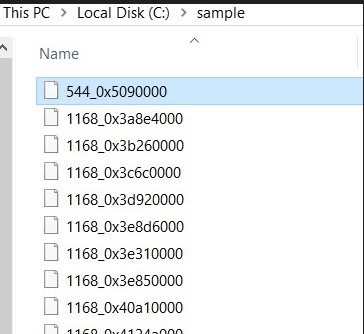
The injected code is dumped into a file 544_0x5090000 as shown in figure below.The File names follows the naming convention "[PID]_[Injected Code Address]".
Note:The tool is based on certain memory heuristics and there would be false positives.
You can use this file for further analysis.. You can reach the final conclusion by combining the output with other tools. An injected code can start with a MZ header which possibly indicates an injected executable. If you observe 55 8B at the start of hexdump, it could possibly the Function Prologue of the injected code. You can do a string analysis on the dumped files using tools like bintext. You might get IOC's present in memory which may be domain names, IP’s, registry entries used by malware.
Video demo of the tool: https://youtu.be/0eflorzoxt0
Please use the tool at your own risk as the tool has not been tested in all kinds of scenarios. A basic testing of the tool has been done on Windows 10, 32 and 64 bits on real and virtual machines.
If you want a customized version of our tool, reach out to us.